
Anomaly to Insight:
A Real-World Root Cause Analysis
Services are stalling, devices are disappearing from dashboards, and metrics are inconsistent. The logs do not provide clear answers.
Welcome to one of our recent real-world incidents in the telecommunications industry.
We used BitSwan and Grafana to trace a fast-moving infrastructure failure as it unfolded. What began as a sudden spike in memory usage quickly snowballed—CPU load surged, services slowed, clients disconnected, and MongoDB lost its primary.
By piecing together system metrics, timeline correlations, and engineering instincts, we unraveled the root cause. This analysis demonstrates how observability tools and focused debugging can transform fragmented symptoms into clear, actionable insights.
Monitoring Data
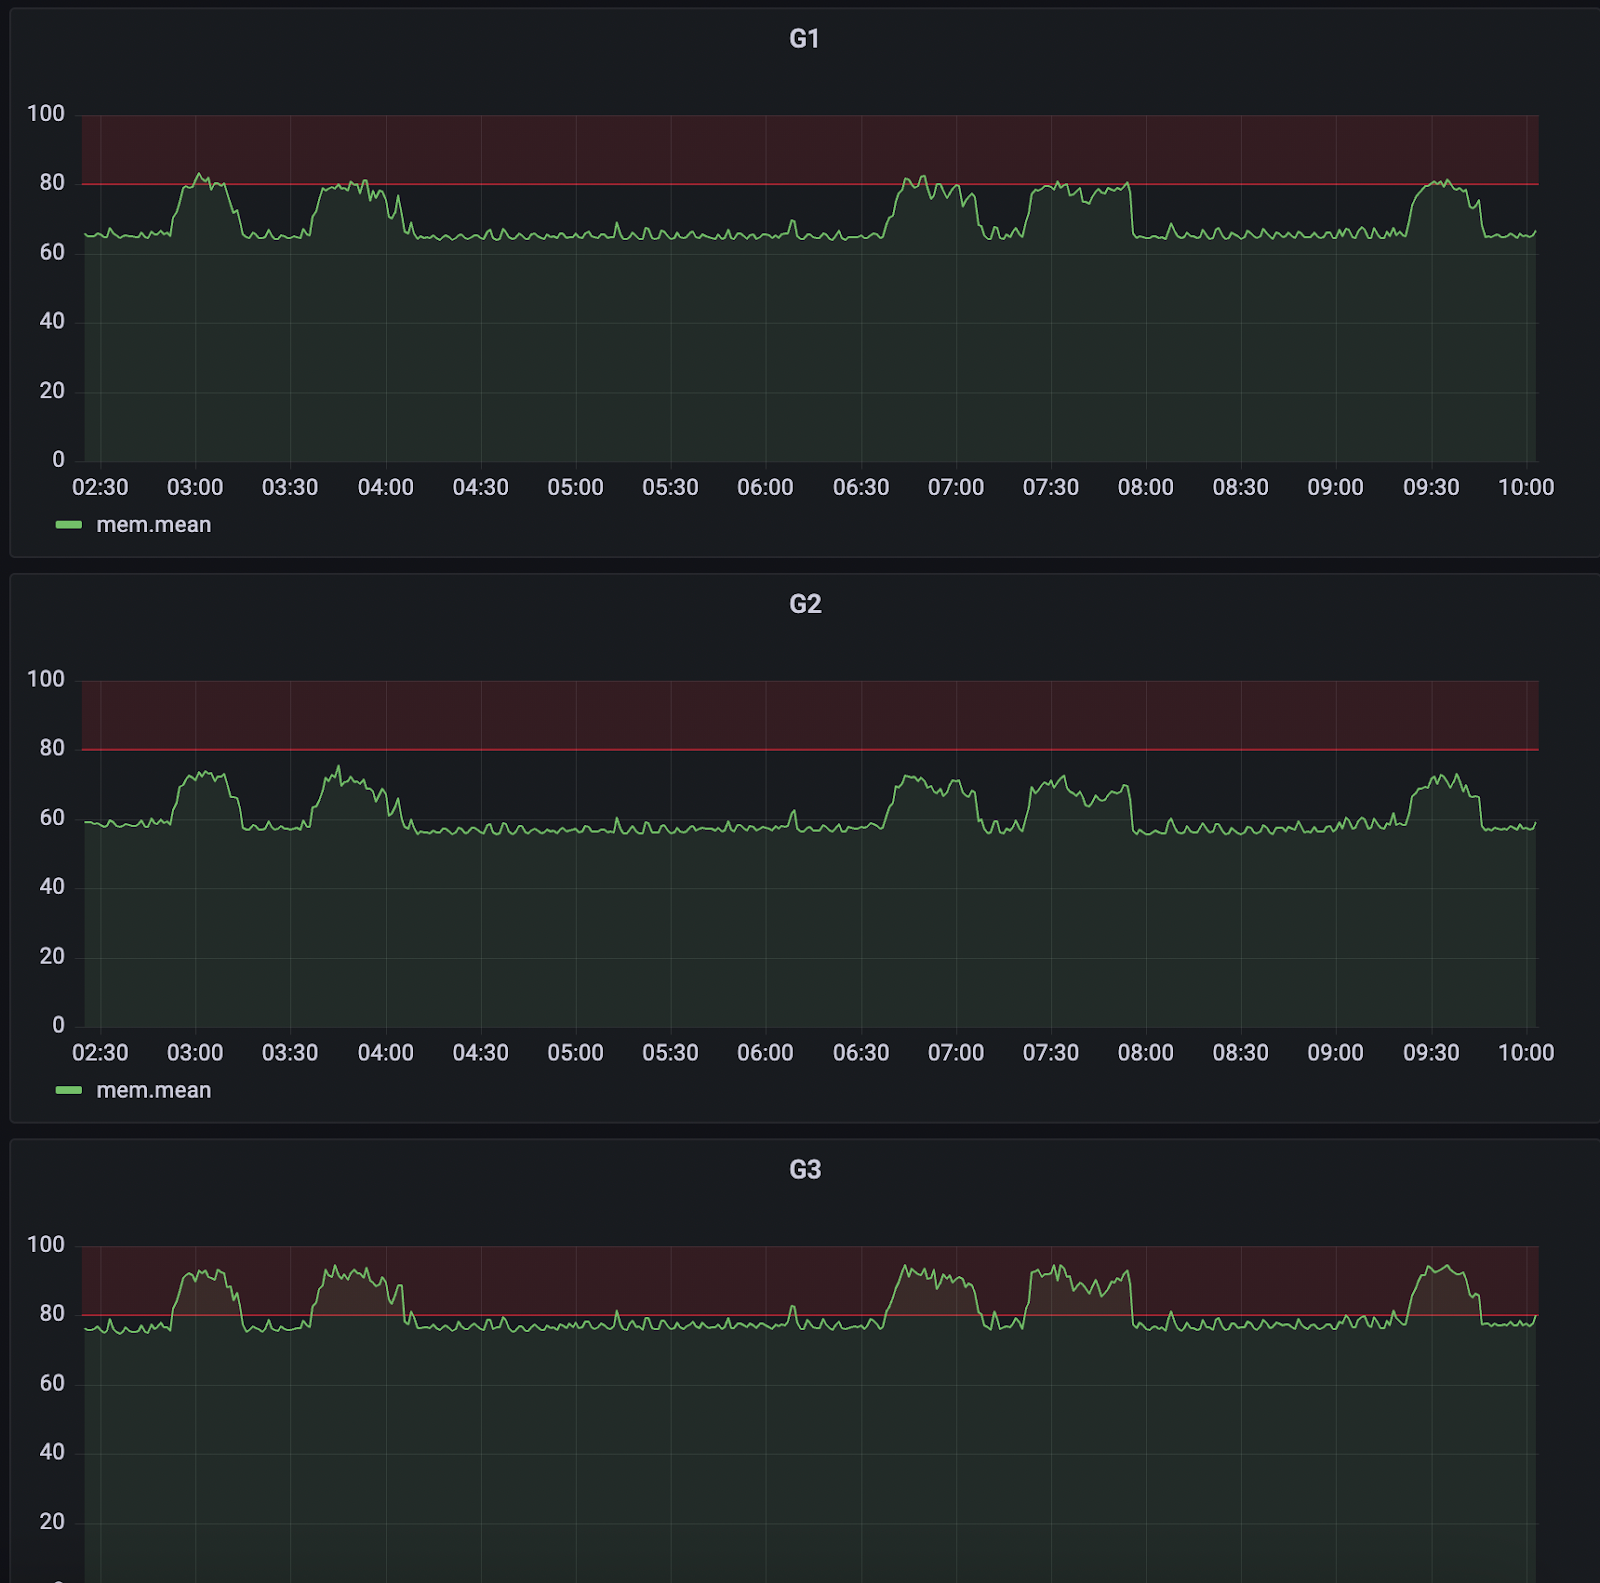
RAM Usage Patterns
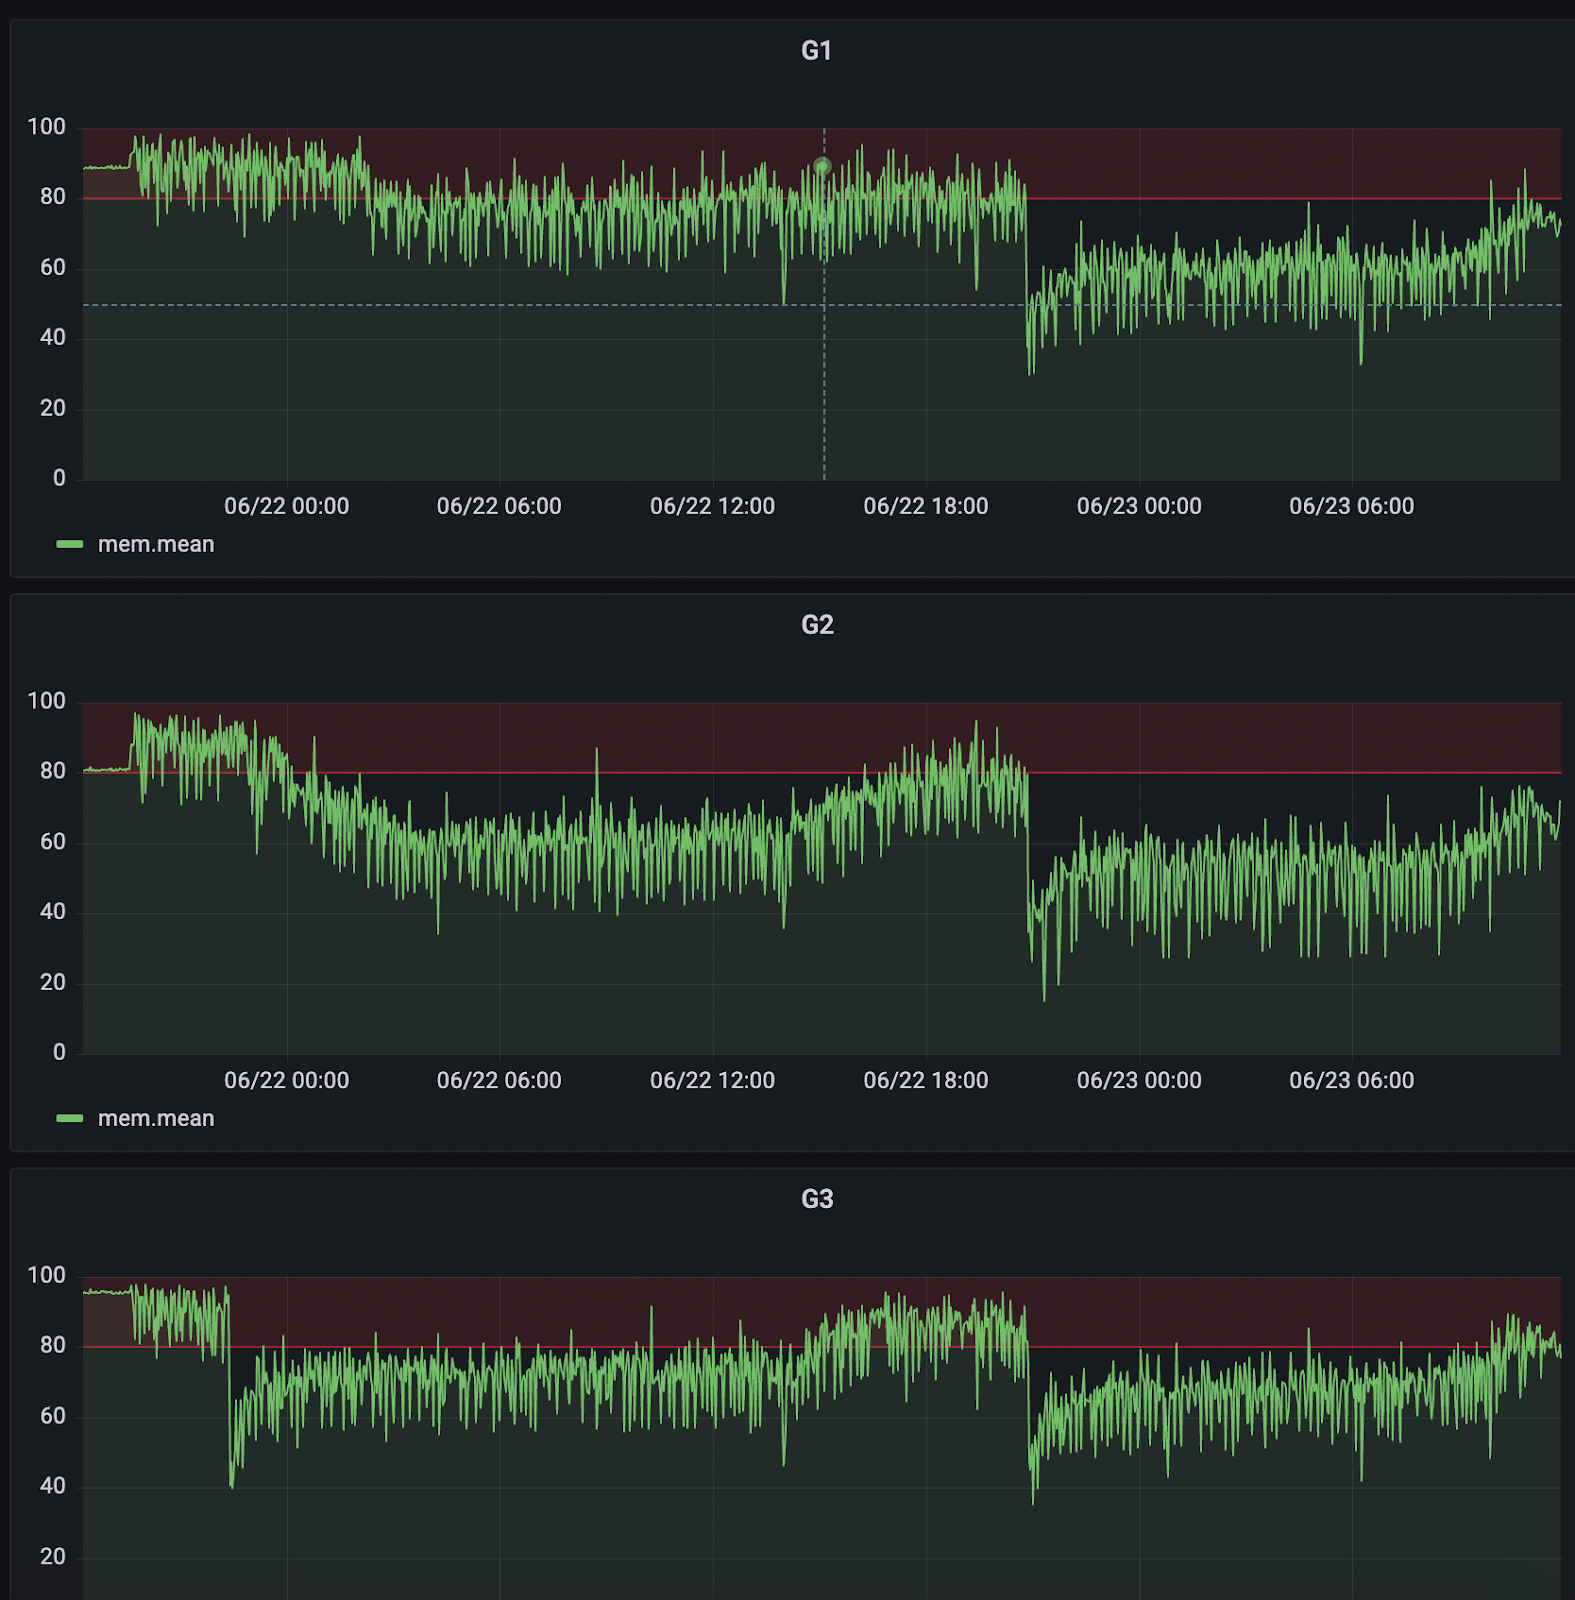
The first red flag appeared with a sudden spike in RAM usage across G1, G2, and G3 nodes.
This wasn’t a gradual increase; it was a clear and immediate anomaly.
Thanks to Grafana dashboards, we were able to spot early warning signs, connect various anomalies into a clear picture, and take action before our clients faced service disruptions.
Whatever caused it affected the cluster simultaneously.
When we looked at previous trends, this behavior stood out as abnormal.
We started examining logs and upstream dependencies, suspecting that something systemic was causing memory pressure.
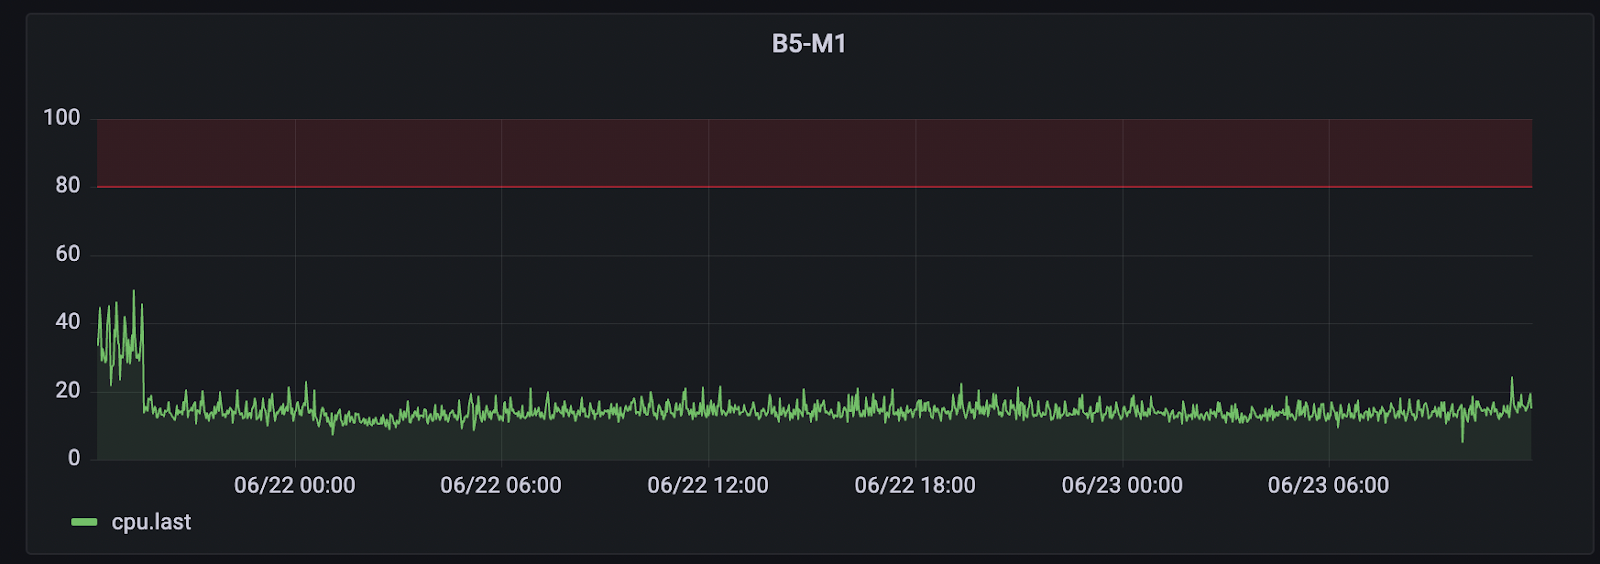
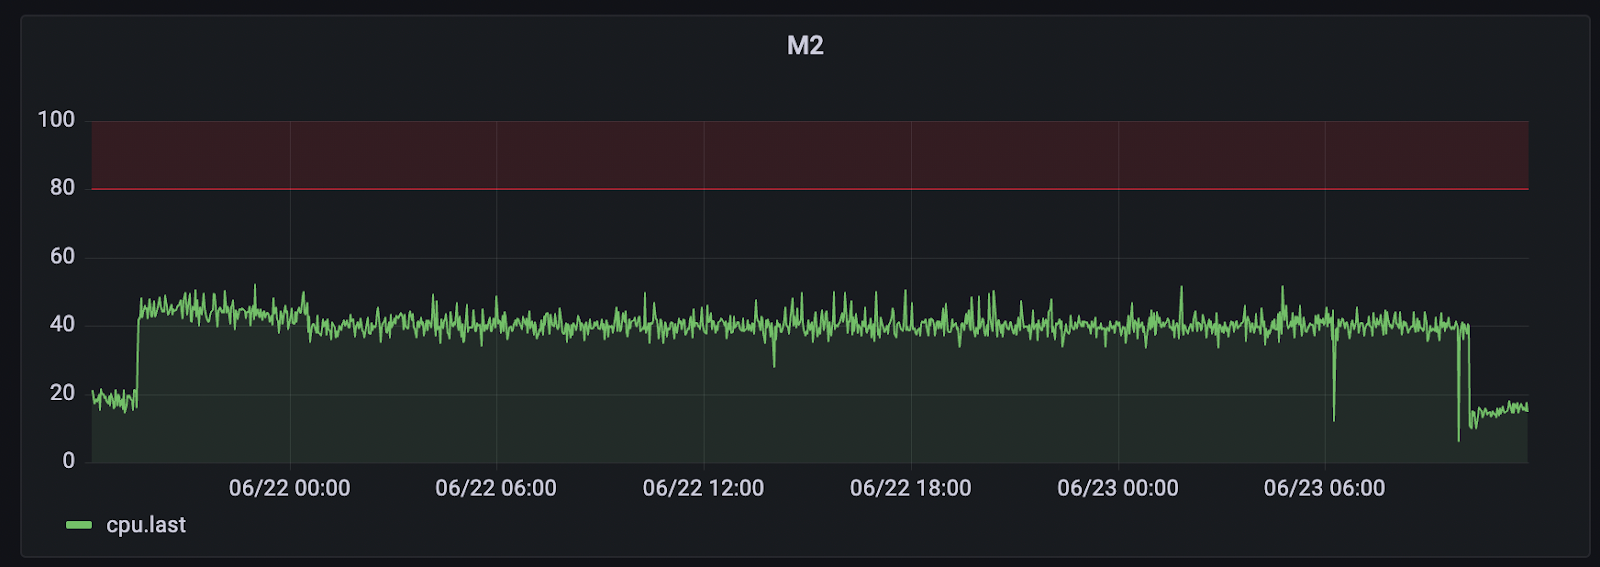
CPU Load Analysis
As RAM usage increased, CPU load jumped just seconds later, especially on M1 and M2 nodes.
This was not just high usage; it was the CPU being overwhelmed by load.
From a developer’s perspective, this kind of pattern typically indicates memory saturation that leads to GC loops.
It was clear this situation required immediate action.
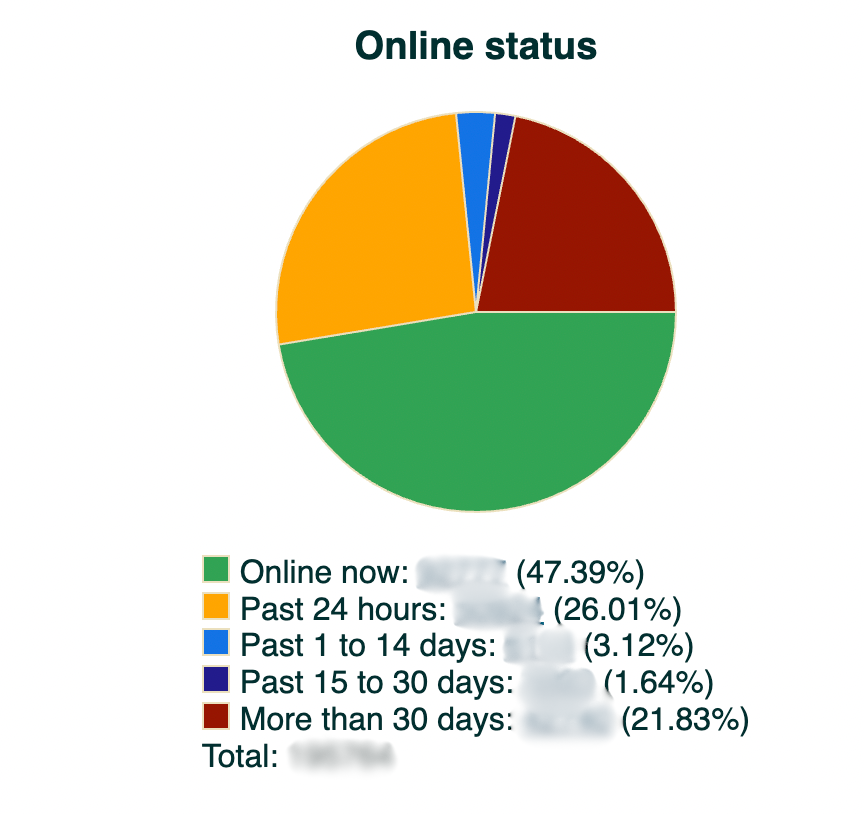
Device Drop-Offs
The edge devices began to disconnect. BitSwan monitoring alerted us to a sharp decline in connections, right when CPU and RAM peaked. Clients were either timing out or disconnecting.
Our device management dashboards matched up perfectly with the ongoing analysis — including the spikes in RAM and CPU usage across the affected nodes.
The backend couldn’t keep up, and the ripple effect severely impacted the clients.
MongoDB Behavior
The initial issue wasn’t due to high memory or CPU usage. Instead, the primary node restarted.
As a result, MongoDB chose a new primary node, which unfortunately had profiling turned on by default.
This misconfiguration added extra load at exactly the wrong time.
The system was already under some strain, and now a critical component was running in a degraded state.
The profiling settings caused spikes in CPU and RAM usage, which worsened performance problems across the cluster.
What first looked like resource exhaustion was actually due to an unexpected failover to a poorly configured node.
Correlation Analysis
By looking at the Grafana timeline, we could clearly trace the chain reaction.
The critical moment was the change in MongoDB’s primary node.
This was evident not only from internal logs but also from a noticeable CPU shift: usage dropped sharply on one server and rose on another.
Soon after, we noticed abnormal RAM behavior across several nodes.
This link indicated that the new primary was the destabilizing factor.
The change didn’t just redistribute the load; it also introduced a misconfigured process into the cluster.
RAM usage patterns, which had been stable before, now displayed irregular and sustained spikes.
In hindsight, the Grafana data showed us everything we needed.
In real time, the signals were lost in noise, but the sequence was all there, just waiting to be connected.
Solution
To stabilize the system, we first reduced the GENIEACS_MAX_CONCURRENT_REQUESTS setting in the GenieACS CWMP component from 1000 to 250.
This adjustment immediately helped reduce backend load and brought temporary stability to the application layer.
However, we continued to observe recurring spikes in RAM usage, which closely aligned with high CPU usage on m1, the MongoDB node that had recently been elected as the new primary.
Unlike the original primary node (b5-g*), which had no profiling enabled, m1 had MongoDB profiling set to level 2.
This profiling configuration introduced significant overhead and degraded performance under load.
To address this, we disabled profiling on all m* MongoDB nodes.
Once this was done, both the RAM and CPU instability affecting the MongoDB primary were fully resolved.
Conclusion
This incident highlights the importance of continuous observability.
BitSwan sent us an alert and brought the dip in connected devices to our attention.
Grafana provided us with the visibility needed to spot early warning signs, connect various anomalies into a clear picture, and take action before our clients faced service disruptions.
By correlating system metrics in real time and combining them with our engineering experience, we stabilized the platform and avoided a widespread infrastructure failure.
These correlations will be automated with BitSwan shortly as well.
The solution did not rely on a single fix; it depended on using the right tools, the right data, and maintaining focus at the right time.
In the end, what could have turned into a major crisis became a success story of vigilance and quick, informed decision-making.