
This post demonstrates how easy it is to turn a BitSwan Jupyter automation—originally triggered manually by a WebFormSource—into a fully automatic process that runs on a schedule and sends the result elsewhere.
In this example, we’ll show how to transform the stock calculator automation into a daily job that sends a stock performance plot to a Discord channel using a webhook.
You can find the original stock automation here: StocksCalculator. If you haven’t created it yet, follow this introductory blog post.
This tutorial builds an automation that selects the current date, fetches stock data, plots performance, and posts it directly to Discord.
Automation Definition
The following sections walk through building this automation.
Imports
First, import the required modules:
from bspump.jupyter import *
from bspump.http.web.server import *
from bspump.common.null import NullSink
from bspump import TriggerSource
from bspump.trigger.crontrig import CronTrigger
import pandas as pd
from datetime import datetime, timedelta, date
import matplotlib
import time
import io
import base64
import requests
import asyncio
import logging
from croniter import croniter
Source
We define a custom source that sends an event with today’s date:
class EventSource(TriggerSource):
    async def cycle(self, *args, **kwargs):
        today = date.today()
        event = {
            "form": {
                "Year": today.year,
                "Month": today.month,
                "Day": today.day
            }
        }
        await self.Pipeline.process(event)
Autopipeline
Our pipeline uses the custom source and a CronTrigger to send the event based on a cron schedule. In this case, we trigger it every 24 hours.
We’re using a NullSink because the output is handled manually via an HTTP request to Discord.
auto_pipeline(
    source=lambda app, pipeline: EventSource(app, pipeline).on(
        CronTrigger(app, "* */24 * * *", init_time=datetime.now())),
    sink=lambda app, pipeline: NullSink(app, pipeline)
)
Business Logic
This logic is identical to the original stock calculator. The cells below:
Handle the input
Fetch and process the data
Create a DataFrame and a plot
First Cell - Handling the input
# Global variables
STOCKS = ["AAPL", "MSFT", "GOOGL", "AMZN", "TSLA", "NVDA", "META", "JPM", "NFLX", "AMD"]
HEADERS = {
        "User-Agent": "Mozilla/5.0 (Windows NT 10.0; Win64; x64)"
        }
# Input processing
form = event["form"]
parsed_date_str = date(form["Year"], form["Month"], form["Day"]).strftime("%Y-%m-%d")
parsed_date = datetime.strptime(parsed_date_str, "%Y-%m-%d")
day_before = parsed_date - timedelta(days=1)
day_after = parsed_date + timedelta(days=1)
Second Cell - Fetching and Processing the Data
# Initialize change tracking
changes = {}
# Iterate over each ticker and fetch data
for ticker in STOCKS:
    # Convert datetime to UNIX timestamps
    start_ts = int(time.mktime(day_before.timetuple()))
    end_ts = int(time.mktime(day_after.timetuple()))
    # Prepare API request
    url = f"https://query1.finance.yahoo.com/v8/finance/chart/{ticker}"
    params = {
        "period1": start_ts,
        "period2": end_ts,
        "interval": "1d"
    }
    try:
        response = requests.get(url, params=params, headers=HEADERS)
        data = response.json()

        result = data["chart"]["result"][0]
        timestamps = result["timestamp"]
        closes = result["indicators"]["quote"][0]["close"]

        # Convert timestamps to readable dates
        dates = [datetime.fromtimestamp(ts).strftime('%Y-%m-%d') for ts in timestamps]
        series = pd.Series(closes, index=dates)

        # Compute percent change if both dates exist in the series
        if parsed_date_str in series and day_before.strftime("%Y-%m-%d") in series:
            previous_close = series[day_before.strftime("%Y-%m-%d")]
            current_close = series[parsed_date_str]
            if previous_close and current_close:
                percent_change = ((current_close - previous_close) / previous_close) * 100
                changes[ticker] = percent_change
    except Exception as e:
        print(f"Error fetching data for {ticker}: {e}")
Third Cell - Creating the Plot
# install matplotlib if you experience error with the plot while executing the cells in during dev
# %pip install matplotlib
# Prepare output if data is available
if changes:
    df = pd.DataFrame(list(changes.items()), columns=["Ticker", "Change (%)"])
    df.sort_values("Change (%)", ascending=False, inplace=True)
    # Plotting
    ax = df.plot.bar(
        x="Ticker",
        y="Change (%)",
        title=f"Stock Change (%) on {parsed_date_str}",
        xlabel="Ticker",
        ylabel="Change (%)",
        grid=True,
        figsize=(10, 7)
    )
    # Save plot to buffer
    buf = io.BytesIO()
    ax.figure.savefig(buf, format="jpeg")
    img_data = buf
Sending to Discord
To send the plot to a Discord channel, you need to create a webhook:
Go to your Discord server and select the desired channel.
Click the gear icon (channel settings).
Choose Integrations → Create Webhook.
Give it a name and copy the Webhook URL.
Then use the code below to post the plot:
webhook_url = os.environ['DISCORD_WEBHOOK_URL']
image_path = './output.png'
if changes:
    with open(image_path, 'rb') as f:
        response = requests.post(
            webhook_url,
            data={'content': 'Today\'s stocks Overview.'},
            files={'file': f}
        )
else:
    reponse = requests.post(
        webhook_url,
        data={'content': 'No stock data available today.'}
    )
Secrets
Now it’s time to explain how to store secrets securely using Bitswan. Navigate to the secrets directory and create a file named discord_secret. In that file, add the following:
DISCORD_WEBHOOK_URL=<YOUR_WEBHOOK_URL>
Next, update your piplines.conf file by adding a secrets section where you specify the name of the secrets file:
[deployment]
pre=<YOUR_PRE>
expose=true

[secrets]
groups=discord_secret
Great! You can now use the secrets in your automation without exposing them directly in your code.
Now, deploy your automation using the BitSwan VS Code extension. When triggered, it will post a message like this:
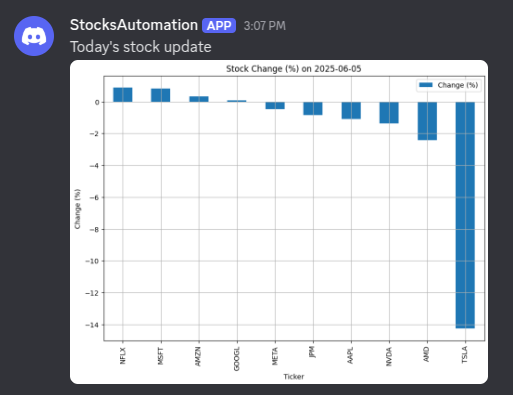
💡 For faster testing, change the cron string to */1 * * * * to trigger the job every minute.
Conclusion
You’re done! As you can see, automating tasks with BitSwan is simple and powerful. This tutorial showed you how to schedule an automation and send its output to a Discord channel.
Feel free to extend this idea and build your own automation workflows!
Good luck with your automation projects!